
From September 3 to 5, the Saigon Exhibition & Convention Centre (SECC) in Ho Chi Minh City hosted the Vietnam International Sourcing Expo 2026, bringing food and beverage, home and houseware, lifestyle and personal care and export supply chain manufacturers together in a single venue. For a sourcing team that spends most of its time inside factories rather than at trade shows, events like this are a fast way to widen the supplier map and put faces to the production lines behind it.

Among the exhibitors we spent time with was Insoexca Group USA, a plastics-industry supplier with more than 40 years in the sector and a factory footprint spanning Vietnam, China, Mexico, and Colombia. Conversations like this one are exactly why we show up in person: catalogs and video calls only go so far and a few minutes on the exhibition floor can tell you more about capacity, quality control and how a factory actually operates than a supplier deck ever will.
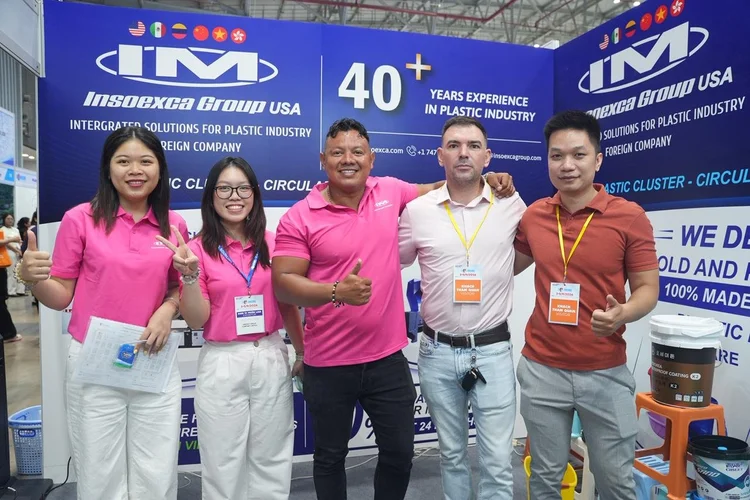
We will keep showing up at expos like this one across Vietnam through the rest of the year and we will keep sharing what we see on the ground here on our news page.
The letter, reported by Vietnam Briefing, responds to a familiar problem. Refund claims were often delayed or pushed into full inspection because a supplier somewhere in the chain had been flagged by the tax system, even when the claimant's own transactions were sound. The Tax Department now draws a clear line between three things: risk information or alerts, system-based high-risk classification and verified findings from an actual inspection. Only the last of these can justify a denial. A refund can be refused only where it is supported by "inspection, verification, or a competent authority's conclusion."
According to the letter, a supplier risk alert is "information for risk assessment and further verification." It does not establish that the underlying transaction is not genuine. Tax officers can use it to decide where to look more closely but they cannot treat it as proof on its own. The same applies where a supplier has ceased operating or been dissolved. That fact is risk information and does not show that the earlier transactions were unlawful.
Where the system flags only part of a refund claim as high-risk, that part may go through pre-refund inspection. The rest "should continue to be processed under the normal refund procedure." The entire claim should not be converted to a pre-refund inspection simply because a portion was flagged and the tax authority does not need to wait for the flagged portion to be verified before processing the compliant amount. In practice that means one questionable invoice should no longer freeze an exporter's whole refund.
| Situation | Treatment under the guidance |
|---|---|
| Risk alert on a direct supplier (F1) | Input for risk assessment. Not grounds for denial without verification |
| Risk alert on an upstream supplier (F2, F3 and beyond) | May inform the overall assessment. Should not on its own push the related input VAT into pre-refund inspection |
| Only part of a claim flagged as high-risk | Flagged part may be inspected. The remainder is processed normally |
| Supplier has not declared or paid VAT (periods from January 1, 2026) | No longer a condition for the buyer's refund. Still relevant as risk information |
| Supplier has ceased operating or dissolved | Risk information only. Does not by itself make the transaction unlawful |
Under the amended VAT Law, from January 1, 2026 the supplier's declaration and payment of VAT is no longer a condition for the purchaser's refund. For periods from that date, the fact that a supplier has not declared or paid the VAT on an invoice cannot on its own be used to deny the buyer's claim. The tax authority may still take it into account when assessing risk.
The letter also narrows the scope of any follow-up. Tax authorities are instructed to limit requests for explanations, additional documents, inspections and verification to the "relevant transactions, invoices and refund amounts associated with the identified risk." Recovering refunds that have already been paid requires proof that the refund conditions were not met. A supplier alert that surfaces later is not enough.
The flip side is that taxpayers must be ready to prove their transactions. When the tax authority asks for explanations or documents, the business has 10 working days from the date of the notice to respond. The guidance points to the records that carry weight:
- Contracts and VAT invoices
- Payment evidence showing funds actually moved
- Delivery and transportation records
- Warehouse records
- Import-export and customs documentation
This is a practical step that should reduce the number of refunds held up by problems a manufacturer did not cause and could not see. It does not remove the need for good records. If anything it shifts the burden toward documentation, because a supplier that can produce clean contracts, payment trails, delivery records and customs files within 10 working days will get its money back while one that cannot will still be stuck. For buyers the lesson is to treat a supplier's tax and document discipline as part of due diligence. Ask how they manage their own input suppliers, whether they have had refund delays and how quickly they can evidence a transaction. Suppliers with strong compliance habits are more likely to stay financially stable and price consistently, which matters more to a sourcing program than any single quote.
Figures from Vietnam's National Statistics Office, reported by VnExpress International, show exports of $374.84 billion (up 22.4 percent) against imports of $395.3 billion (up 35.3 percent). Because imports grew faster than exports, the country ran a deficit over the period. For anyone sourcing from Vietnam the more useful questions are what those imports consist of and who is bringing them in.
The split by ownership is the clearest signal in the data. Foreign-invested enterprises shipped $300.37 billion (80.1 percent of all exports) and grew 26.9 percent. Domestic companies exported $74.47 billion for a 19.9 percent share and grew 7.4 percent. The import side follows the same pattern: foreign-invested firms brought in $290.23 billion (up 40.1 percent) while domestic firms imported $105.07 billion (up 23.7 percent).
| Sector | Exports | Growth | Imports | Growth |
|---|---|---|---|---|
| Foreign-invested | $300.37B | +26.9% | $290.23B | +40.1% |
| Domestic | $74.47B | +7.4% | $105.07B | +23.7% |
| Total | $374.84B | +22.4% | $395.3B | +35.3% |
Manufacturing dominates the export mix and the mix is highly concentrated. Thirty-three product lines each passed $1 billion and together made up 93.6 percent of shipments. Seven of them each passed $10 billion and together accounted for 70 percent of all exports.
- Manufactured industrial products: $337.99 billion (90.2 percent of exports)
- Agricultural and forestry products: $26.65 billion (7.1 percent)
- Seafood: $8 billion (2.1 percent)
- Fuels and minerals: $2.2 billion (0.6 percent)
Production inputs made up $372.04 billion of imports, or 94.1 percent. Machinery, equipment, tools and spare parts accounted for 57.6 percent of total imports while raw materials, fuels and other inputs accounted for 36.5 percent. Consumer goods came to only $23.26 billion (5.9 percent). Forty-three import items passed $1 billion each and made up 93.9 percent of the total. Three passed $10 billion and made up 55.5 percent. Put simply the import surge is largely factories buying equipment and materials rather than households buying finished goods.
The United States remained the largest destination for Vietnamese exports at $122 billion. China remained the largest source of imports at $161.9 billion. By our calculation that puts the US at about 32.5 percent of exports and China at about 41 percent of imports.
Trade turnover in August was $109.7 billion, essentially flat on July (down 0.1 percent) and up 31.7 percent on August last year. Exports reached $54.79 billion (up 3.2 percent on the month and 26 percent on the year). Imports came to $54.91 billion (down 3.1 percent on the month and up 37.9 percent on the year). Exports and imports were almost level in August with only $0.12 billion between them.
The numbers confirm that Vietnam is scaling as a manufacturing base rather than only as an assembly location and that foreign-invested plants remain the engine. The head of the National Statistics Office, Nguyen Thi Huong, has urged a push toward "a sustainable trade surplus" by making better use of free trade agreements. For buyers that translates into practical homework: check which preferences apply to the products you source (EU buyers should look at EVFTA) and make sure supplier origin documentation is in order before goods ship. Buyers who treat that paperwork as part of sourcing rather than an afterthought will be best placed as trade volumes keep climbing.
Vietnam's rise as a China+1 manufacturing base was never in question. What has changed since mid-2025 is how closely US Customs and Border Protection (CBP) now checks whether goods labeled "Made in Vietnam" actually earned that origin, or whether they are Chinese-made products that picked up a Vietnamese address on the way to the US market. The distinction is decided by a single legal doctrine, substantial transformation, and getting it wrong is now one of the most expensive mistakes an exporter or buyer can make.
Under 19 CFR §134.1(b), a product only becomes Vietnamese in origin if Vietnamese processing gives it "a new name, character, or use" that it did not have when its components arrived. CBP does not apply a fixed percentage of local value or a minimum number of production steps. Instead, it asks a narrower question for each product: which single component or process gives the finished good its functional identity, and did that step happen in Vietnam?
A CBP ruling on imported vehicle control arms illustrates how this plays out in practice. CBP identified the ball joint assembly as "the character" of the part, and because Vietnamese components and labor made up more than 64 percent of the cost for each model examined, Vietnam qualified as the country of origin. Simple assembly of a finished mechanism, by contrast, does not count, no matter how much labor goes into fitting it together. The burden of proof sits with the importer of record, not the Vietnamese factory, which means US buyers carry the compliance risk even when the paperwork problem originates upstream.
Because there is no formula, CBP rulings and customs counsel point to patterns rather than thresholds. Processing that creates the product's defining component tends to hold up. Processing that merely finishes, packages, or connects an already-complete foreign component tends to fail.
| Operation Performed in Vietnam | Typical Outcome |
|---|---|
| Cutting, sewing, and finishing garments from raw fabric | Passes — new character created |
| SMT population, soldering, and firmware loading of a main circuit board | Passes — creates the product's "brain" |
| Frame fabrication and welding from raw tube stock | Passes — defines structural identity |
| Inserting a finished Chinese mechanism into a Vietnamese-made housing | Fails — origin stays with the mechanism |
| Repackaging or lightly finishing completed Chinese furniture | Fails — flagged directly by CBP alert |
| Final screw, paint, or packing station only | Fails — insufficient transformation |
The penalty structure behind this test has moved through several legal vehicles since mid-2025 but has kept its bite throughout. The US-Vietnam framework agreement of July 2025 paired a reciprocal tariff with a 40 percent transshipment penalty under HTS code 9903.02.01 for goods CBP determines were routed through Vietnam to evade duties owed on their true country of origin. CBP issued a CTPAT alert in December 2025 specifically flagging Chinese wooden bedroom furniture relabeled "Made in Vietnam" after only light processing.
The legal basis shifted again after the US Supreme Court's February 2026 ruling in Learning Resources, Inc. v. Trump, which invalidated tariffs imposed under the International Emergency Economic Powers Act. The transshipment penalty was reissued under separate trade authority and has continued to apply through 2026 as the underlying reciprocal tariff itself moved from a temporary Section 122 surcharge to the 12.5 percent Section 301 rate that took effect July 24, 2026. In late July 2026, CBP conducted unannounced inspections of Chinese-linked factories in Vietnam, examining production records and value-added ratios directly; reporting on the raids indicated no confirmed evidence of illegal transshipment was found, but the exercise underlined that CBP is now checking factory floors, not just paperwork.
- Bill of materials listing every input by country of origin, value, and HS code
- A manufacturing process narrative that matches what actually happens on the factory floor, not a generic description
- Signed supplier affidavits from the Vietnamese factory confirming the processing performed
- A certificate of origin issued through Vietnam's Ministry of Industry and Trade or the eCoSys system, consistent with the commercial invoice and packing list
- Production records — lot numbers, dates, machine logs — traceable back to the specific shipment
- For high-volume or gray-area products, a CBP binding ruling request under 19 CFR Part 177 to get certainty in advance
The direction of enforcement is now clear enough that "final assembly in Vietnam" is no longer a sourcing story that survives scrutiny on its own. Buyers who can show which Vietnamese process actually creates their product's character, backed by documentation prepared before shipment rather than reconstructed after a customs inquiry, have little to fear from either the 40 percent transshipment penalty or the broader Section 301 tariff regime. Buyers relying on light processing of finished Chinese goods should treat the July 2026 factory raids as a preview rather than an isolated event, and revisit sourcing structures before CBP revisits them for you.
The new tariff is not an isolated Vietnam measure. It is one of 60 separate Section 301 investigations USTR has opened against major US trading partners since March 2026, and each investigation stands on its own legal footing. An exemption granted to another country, or a successful legal challenge against another country's tariffs, does not automatically apply to Vietnam.
USTR's investigation, launched in March 2026, assessed how well Vietnam enforces its restrictions on goods made with forced labor rather than accusing Vietnam of systematic forced labor use. USTR concluded that gaps in Vietnam's enforcement mechanisms may allow forced labor linked goods to enter international supply chains and compete unfairly with products made in the United States. That finding is the basis for the new tariff.
Two changes stand out for exporters already working through Vietnam. First, a tariff rate quota program that softens textile and apparel tariffs applies to Bangladesh, Cambodia, Indonesia, and Malaysia. Vietnam is explicitly excluded, which puts Vietnamese textile and garment exporters at a relative disadvantage against regional competitors who qualify.
Second, goods entering US Foreign Trade Zones must now generally use what is called privileged foreign status. That locks in a product's tariff classification at entry and removes much of the flexibility that zone processing previously offered for managing duties.
| Country | Textile & Apparel Quota Relief |
|---|---|
| Bangladesh | Yes |
| Cambodia | Yes |
| Indonesia | Yes |
| Malaysia | Yes |
| Vietnam | No |
- Verify HTSUS classifications for exported goods and check eligibility against the Annex I and Annex II exemption lists
- Review forced labor risk across suppliers and subcontractors, not just direct factory relationships
- Recalculate landed costs under the 12.5 percent rate and revisit pricing in existing customer contracts
- Reassess whether Foreign Trade Zone strategies still make sense under the new privileged foreign status rule
- Monitor HTSUS updates and exemption list amendments, since product coverage can shift
Vietnam remains competitive on cost and capacity, but the margin for undocumented supply chains has narrowed. Buyers who can show clean, traceable sourcing will feel little practical change. Buyers who cannot will find that gap increasingly expensive to close after the fact. We recommend treating this as a prompt to formalize supplier audits now, rather than waiting for a customs question to force the issue.
Sixty three percent of surveyed businesses described current conditions as positive, and 69 percent expect conditions to stay favorable over the next three months, an 11 percentage point jump from the prior quarter. The improvement is broad rather than driven by a single factor, but it comes alongside persistent complaints about administrative delays, talent shortages, and rising international costs.
Among businesses reporting positive conditions, sales, revenue, and profit growth was the most commonly cited reason, followed closely by a stronger pipeline of leads and orders.
- Sales, revenue, and profit growth: 36 percent
- Leads, orders, and new opportunities: 32 percent
- Market demand and spending power: 24 percent
- Sector-specific demand and FDI activity: 21 percent
- Operational expansion: 10 percent
Regulatory and administrative friction remains the most widely cited constraint. Fifty three percent of respondents pointed to regulatory delays and tax administration, 33 percent said administrative procedures were slowing down projects, 29 percent cited compliance burdens, and 27 percent described regulatory complexity generally. Talent shortages were flagged by 38 percent of businesses, making hiring one of the more persistent operational pain points.
Among businesses that hold intellectual property registrations, 32 percent reported challenges with registration or enforcement, 28 percent pointed to weak dispute resolution mechanisms, and 18 percent cited administrative delays specific to IP matters.
Forty six percent of respondents said global trade uncertainty had a negative impact on their international operations, and roughly a third reported mixed effects. The cost side of that uncertainty is significant: more than three quarters of internationally active businesses reported higher freight, shipping, and logistics costs, and a similar share reported higher energy and fuel costs.
| Cost Pressure (Internationally Active Businesses) | Share Reporting Increase |
|---|---|
| Freight, shipping, and logistics costs | 78% |
| Energy and fuel costs | 76% |
| Extended supply chain buffers | 53% |
| Transit time extended by two or more weeks | 25% |
The financial impact of these pressures was mixed but manageable for most: about half of affected businesses reported losses under 10 percent, while 4 percent reported losses exceeding 30 percent, and 14 percent actually reported positive financial outcomes despite the disruption. More than half of internationally active businesses also said Rules of Origin compliance had become more difficult, a signal that documentation and traceability requirements are tightening across the board.
A seven point jump in the BCI in a single quarter is a meaningful vote of confidence from European businesses operating in Vietnam, especially set against a backdrop of tariff uncertainty and rising freight costs. The underlying message for buyers is consistent with what we have been seeing on the ground: Vietnam's fundamentals remain attractive, but the businesses thriving in this environment are the ones that have already invested in compliance, documentation, and supply chain resilience. Sentiment is improving faster than the operating friction is easing, and that gap is where a good sourcing partner earns their keep.
Vietnam's economy grew 8.18 percent year-on-year in the first half of 2026, up from 7.63 percent in the same period of 2025, with manufacturing and processing once again the primary engine — value added in the sector rose 10.23 percent and contributed roughly a third of overall economic growth. International forecasters now project full-year growth between 7.2 and 8.5 percent, against the government's own ambitious 10 percent target.
The S&P Global Manufacturing PMI came in at 51.8 in June, down from May's 52.8 but comfortably in expansion territory. The composition of the reading actually improved: new orders and output kept growing, and — importantly — the growth is now attributed to genuinely improving customer demand rather than the precautionary stockpiling that inflated May's figure.
The most welcome shift is on costs. After input inflation hit multi-year highs in the spring, cost pressures eased sharply in June. The soft spot remains employment, which declined for a fourth consecutive month — a signal that factories still have spare capacity at current production levels.
The Index of Industrial Production rose an estimated 10.8 percent year-on-year in H1 — the best first-half performance since 2019, accelerating from 8.7 percent a year earlier. Manufacturing and processing alone expanded 11.4 percent. Growth in the categories international buyers source most:
| Industry | IIP Growth H1 2026 (% YoY) |
|---|---|
| Basic metals | +21.5% |
| Motor vehicles | +17.7% |
| Beverages | +15.4% |
| Chemicals and chemical products | +14.8% |
| Fabricated metal products | +13.9% |
| Furniture | +12.6% |
| Rubber and plastics | +11.8% |
| Wood, bamboo, and rattan products | +11.5% |
| Food manufacturing | +11.1% |
| Electronics, computers and optical products | +10.9% |
| Leather and related products | +4.0% |
Notable for buyers: furniture, wood/rattan, fabricated metals, and rubber/plastics — core Vietnam sourcing categories — are all growing at double digits. Leather goods are the outlier, decelerating sharply from 16.4 percent growth a year ago to 4.0 percent.
Merchandise exports reached US$266.52 billion in H1 2026, up 21.0 percent year-on-year, with manufactured goods making up 90 percent of the total. The concentration remains striking: foreign-invested enterprises accounted for 79.9 percent of exports, while domestic enterprises grew just 4.6 percent.
| Export Category (H1 2026) | Value (US$ billion) | YoY Growth |
|---|---|---|
| Electronics, computers & components | 71.2 | +49.1% |
| Machinery, equipment & tools | 33.2 | +23.6% |
| Phones & components | 31.6 | +17.8% |
| Textiles & garments | 18.9 | +0.9% |
| Footwear | 11.9 | +0.5% |
The two-speed pattern from earlier in the year has hardened: electronics and machinery are booming, while textiles and footwear are essentially flat. For buyers in soft goods, flat export volumes combined with the easing cost environment translate into genuine negotiating room; in electronics-adjacent categories, expect tighter capacity and less pricing flexibility.
Industrial employment rose 3.1 percent year-on-year as of June 1, with foreign-invested enterprises again leading headcount growth. On the policy side, Vietnam's 2026–2030 development plan targets 12.4 percent average annual growth in manufacturing and processing, a 40–45 percent localization rate for key industries by 2030, and new private-sector incentives under Decree 20/2026 covering tax relief, land access, and digital transformation support — all signals that the manufacturing build-out has sustained government backing behind it.
H1 2026 was the strongest half for Vietnamese manufacturing since before the pandemic, and the quality of the growth improved as it went: by June, expansion was demand-driven rather than stockpile-driven, and cost inflation was finally cooling. The FDI-sector dominance of exports remains the structural caveat we flag consistently — knowing which part of Vietnam's supplier ecosystem you are actually buying from matters as much as the headline numbers.
Practically: the second half opens with a favorable setup for buyers — easing input costs, spare factory capacity in labor-intensive categories, and suppliers motivated to fill order books. For soft goods especially, this is a good moment to negotiate. For electronics and technical products, book capacity early.
On June 30, 2026, the Vietnamese government issued Decree No. 255/2026/ND-CP, replacing the previous transfer pricing framework (Decrees 132/2020 and 20/2025) with one unified set of rules for related-party transactions. The decree applies from the 2026 corporate income tax period and brings Vietnam's regime closer to OECD standards — a notable move given the increased international scrutiny of Vietnam's tax practices following its recent inclusion on the EU's list of non-cooperative jurisdictions.
The most business-friendly change is a substantial relaxation of documentation requirements. The revenue threshold below which companies are exempt from preparing transfer pricing documentation jumps from VND 200 billion to VND 500 billion (roughly US$19 million), and the old condition that exempt taxpayers perform only "simple business functions" has been dropped entirely.
In practice, this takes many small and mid-sized foreign-invested entities — including trading companies and buying offices that invoice a related parent or group companies — out of the annual documentation exercise altogether, cutting real compliance cost.
At the same time, the decree expands when two parties are considered related. New triggers include the transfer or acquisition of at least 25 percent of contributed capital during a tax period, and loans from individuals who control the enterprise (or their related persons) equal to at least 10 percent of contributed capital. Definitions of Ultimate Parent Entity and tax treaty concepts have been aligned with OECD and Global Minimum Tax terminology.
| Area | What Changed Under Decree 255 |
|---|---|
| Comparable data | Formal hierarchy for benchmarking: public databases first, then commercial, then tax authority data — plus a new National Database |
| Country-by-country reporting | Threshold reset to €750M in group revenue (prior year basis); XML e-filing; single one-off notification; filing within 12 months of the parent's year-end |
| Use of CbCR data | Explicitly limited to risk assessment — cannot be the sole basis for a transfer pricing adjustment |
| Taxpayer support | Authorities to publish industry profit margin benchmarks by sector and region; voluntary compliance programs introduced |
| Transition | Interest expense carry-forwards under the old rules remain usable until they expire |
The move toward standardized databases and published industry benchmarks should reduce one of the most common friction points in Vietnamese transfer pricing audits: disputes over which comparables are acceptable. It also means the tax authority will have clearer sector-level profit expectations — companies whose margins sit far outside published benchmarks can expect questions.
For most international buyers sourcing from Vietnam on a straightforward purchase-order basis with unrelated suppliers, Decree 255 changes nothing day-to-day. The rules bite where there is a related-party structure: a Vietnamese subsidiary, a jointly owned trading entity, or intra-group financing.
For companies in that position, the sensible pre-filing checklist is short: reassess whether the expanded related-party definitions capture any of your arrangements, check whether the higher VND 500 billion exemption now applies to you, and confirm your group's CbCR position under the €750 million threshold. Enforcement attention on transfer pricing in Vietnam is rising, not falling — but the compliance path for smaller, well-documented operations just got noticeably easier.
As always, consult a qualified Vietnamese tax advisor for how the new rules apply to your specific structure.
The European Chamber of Commerce in Vietnam (EuroCham) has published its Q2 2026 Business Confidence Index (BCI), the 15th-anniversary edition of its quarterly survey of European businesses on the ground in Vietnam. The headline index rose to 79.7, up from 72.7 in Q1 — and the underlying data suggests confidence is now running on genuine market fundamentals rather than post-crisis recovery momentum.
The improved sentiment is anchored in commercial performance rather than optimism alone. Among the 63 percent of respondents reporting a positive quarter, the leading drivers were rising sales, revenue, and profitability (36 percent), growing order books and new contract wins (32 percent), and stronger domestic consumer demand (24 percent). Forward-looking sentiment improved even more sharply: 69 percent of European businesses expect favorable conditions over the next three months, an 11-percentage-point jump from the previous edition.
For international buyers, the most relevant finding sits in the supply chain section. Despite geopolitical friction, respondents reported increased production orders and investment flowing into Vietnam as global manufacturers continue diversifying away from concentrated sourcing footprints. Companies with stronger integration into EU–Vietnam trade proved notably more resilient to external shocks — a point in favor of Vietnam's established trade architecture, including the EVFTA.
The report reinforces what we see on the factory floor every week: Vietnam's position as a regional manufacturing and sourcing hub keeps strengthening precisely because of global uncertainty, not in spite of it.
The survey is equally candid about the friction. Global uncertainty is showing up primarily as higher operating costs rather than reduced activity:
| Impact of Global Uncertainty | Share of Affected Businesses |
|---|---|
| Higher freight, shipping, and logistics costs | 78% |
| Higher energy and fuel costs | 76% |
| Extended supply chain buffer times | 53% |
| More than two weeks added to transit schedules | 25% |
Rules-of-origin compliance has also become harder. More than half of internationally active respondents said geopolitical developments have complicated RoO compliance — particularly obtaining supplier documentation, demonstrating manufacturing transformation, and managing fragmented sourcing networks.
The survey's biggest caveat is domestic rather than global. More than half of respondents (53 percent) identified regulatory delays, policy inconsistency, and tax administration as their main obstacles to long-term expansion, with lengthy licensing procedures and VAT refund delays among the recurring complaints. Intellectual property protection also remains on the watchlist: among businesses with registered IP in Vietnam, 32 percent experienced registration or enforcement challenges.
For buyers, this is less a red flag than a reminder: paperwork, approvals, and follow-up in Vietnam still move at the speed of persistent, on-the-ground engagement.
The financial impact of global disruption on European firms in Vietnam has stayed manageable — around half of affected businesses reported losses under 10 percent, and 14 percent actually recorded positive outcomes from supply chain realignment. Combined with rising order books and strengthening forward sentiment, the picture is of a sourcing destination absorbing global shocks rather than suffering from them.
The practical message for buyers: Vietnam's attractiveness is intact and arguably growing, but the cost of getting goods out — freight, energy, compliance overhead — is where the pressure now sits. Buyers who plan around today's logistics realities, and who verify their suppliers' origin documentation capabilities up front, are best positioned to benefit from Vietnam's expanding manufacturing base.
We track Vietnam manufacturing data regularly so buyers don't have to piece it together from multiple sources. Here is our mid-2026 snapshot of the indicators that matter most for sourcing decisions.
Vietnam recorded 8.2 percent GDP growth in 2025 — one of its strongest years in over a decade — and the economy officially crossed the US$500 billion threshold for the first time. Manufacturing was the primary engine, with value added in the sector rising 9.97 percent year-on-year, the highest rate recorded in the 2019–2025 period.
For 2026, international forecasts remain broadly positive. Standard Chartered projects 7.2 percent GDP growth for the full year, while the ASEAN+3 Macroeconomic Research Office forecasts 7.6 percent. The Vietnamese government's own target is more ambitious at 10 percent, though most external analysts consider that a stretch goal rather than a baseline expectation.
Vietnam's S&P Global Manufacturing PMI rose to 52.8 in May 2026, up from 50.5 in April — the strongest reading since February and firmly in expansion territory. New orders and output both accelerated, and purchasing activity increased for the first time in three months.
However, the picture is not straightforwardly positive. A portion of the demand driving May's strong numbers appears to be precautionary — buyers stockpiling ahead of anticipated price increases rather than reflecting genuine underlying demand growth. Export orders returned to growth but only modestly.
Despite stronger output, manufacturers continued to reduce headcount in May — an indicator of spare capacity across the sector rather than labour tightness. This is a useful counterpoint to concerns about Vietnam's labour availability, at least at the current production level.
Vietnam's Industrial Production Index rose 9.1 percent year-on-year in the first five months of 2026 — the highest growth rate in four years. In May alone, industrial output was up 8.8 percent compared to the same month in 2025.
The table below shows IIP growth across key manufacturing categories relevant to international buyers:
| Industry | IIP Growth Jan–May 2026 (% YoY) |
|---|---|
| Basic metals manufacturing | +20.2% |
| Motor vehicles manufacturing | +18.0% |
| Chemicals and chemical products | +16.9% |
| Other non-metallic mineral products | +16.2% |
| Beverage manufacturing | +15.1% |
| Rubber and plastics products | +10.9% |
| Paper and paper products | +10.7% |
| Furniture manufacturing | +11.6% |
| Textile manufacturing | +9.3% |
| Electronics, computers and optical products | +7.5% |
| Fabricated metal products | +9.6% |
Furniture, textiles, rubber and plastics, and fabricated metals — all core sourcing categories for international buyers in Vietnam — are showing solid production growth. Electronics growth at 7.5 percent is positive but more modest than the sector's headline export numbers might suggest, reflecting capacity constraints in some subsectors.
Vietnam's total merchandise exports reached US$215.66 billion in the first five months of 2026, up 19.5 percent year-on-year. Foreign-invested enterprises accounted for 79.8 percent of that total — a figure that underscores how export capacity in Vietnam remains heavily concentrated in the FDI sector rather than domestic manufacturers.
The top export categories in Q1 2026 by value:
| Export Category | Value (US$ billion) | YoY Growth |
|---|---|---|
| Electronics, computers & components | 30.7 | +45.5% |
| Phones & components | 16.7 | +19.3% |
| Machinery, equipment & tools | 15.0 | +21.2% |
| Textiles & garments | 8.9 | +1.9% |
| Footwear | 5.4 | +0.8% |
Electronics growth of 45.5 percent is striking and reflects continued investment by major global manufacturers in Vietnam's electronics ecosystem. Textiles and footwear growth is much more subdued at under 2 percent — consistent with the cost pressures and modest export order growth seen in PMI data.
FDI into Vietnam's processing and manufacturing sector reached US$9.8 billion in newly registered capital in 2025 across 1,381 new projects — the highest project count in the dataset going back to 2016, though registered capital per project was lower than in peak years.
Singapore remained the largest source of manufacturing FDI in 2025 at US$4.84 billion (27.9% of total), followed by China at US$3.64 billion (21.0%) and Hong Kong at US$1.73 billion (10.0%). Japan came fourth at US$1.62 billion.
Industrial employment continued to increase as of May 1, 2026. Manufacturing and processing employment rose 1.2 percent month-on-month and 3.5 percent year-on-year. Foreign-invested enterprises saw the strongest headcount growth at 3.4 percent year-on-year, while domestic non-state enterprises grew at 2.6 percent.
The caveat from PMI data is worth noting here: despite overall employment growth in the sector, individual manufacturers were still reducing headcount in May — suggesting the aggregate growth is concentrated in expanding facilities rather than reflecting broad-based labour demand across the sector.
Vietnam's manufacturing fundamentals remain strong heading into the second half of 2026. GDP growth, industrial output, and export volumes are all tracking positively. The PMI expansion in May is encouraging, though the precautionary demand element and accelerating input cost inflation are worth watching closely.
For buyers with active sourcing operations, the most actionable signal from this data is on costs. Input price inflation at a 15-year high means suppliers are under pressure, and pricing conversations for new orders or renewals should account for that. Locking in contracts or material commitments earlier rather than later is a sensible hedge in the current environment.
The dominance of FDI-sector exports — nearly 80 percent of Vietnam's total — also reinforces a point we make consistently: Vietnam's export manufacturing capability is strong, but it is concentrated. Buyers need to identify which part of Vietnam's supplier ecosystem they are actually accessing, and whether those suppliers have the systems, capacity, and compliance standards their supply chain requires.
For international buyers and sourcing professionals, the resolution is worth understanding — not because it changes day-to-day sourcing operations immediately, but because it signals the direction Vietnam's manufacturing economy is moving over the next five years.
Vietnam's previous FDI model relied heavily on corporate tax incentives to attract foreign manufacturers. With the global minimum tax now reducing the effectiveness of those tools, policymakers have shifted focus toward performance-based incentives — rewarding investors based on measurable contributions like R&D spending, workforce training, technology adoption, and local supplier development.
The resolution also moves investment promotion away from individual provinces and administrative boundaries, instead organising attraction around industrial clusters, value chains, and strategic sectors. In practice, this means investment decisions will increasingly be evaluated on quality rather than scale.
The resolution identifies a clear set of industries that Vietnam wants to develop as part of its next phase of industrialisation:
- Electronics, semiconductors, and digital equipment
- Artificial intelligence, big data, cloud computing, and IoT
- Advanced biotechnology and biomedicine
- Green industries and sustainable manufacturing
- Modern logistics and supply chain services
- Innovation-driven and high value-added manufacturing
The government also wants to attract at least three leading global technology corporations to establish headquarters or R&D centers in Vietnam before 2030 — a target that reflects broader ambitions to move up the global value chain beyond assembly and processing.
For international buyers, the practical implications are gradual rather than immediate. Vietnam's core strengths in furniture, textiles, packaging, consumer goods, and electronics assembly remain intact and are not disrupted by this policy shift.
The longer-term picture is more significant. As Vietnam attracts more technology-intensive investment and pushes localization rates toward 45–50%, the supplier ecosystem will gradually become more sophisticated. Buyers who are currently sourcing from Vietnam — or evaluating it as part of a China+1 strategy — are likely to find a broader and more capable manufacturing base over the coming years.
The push to develop approximately 10,000 domestic enterprises into FDI supply chains, including 500–1,000 Tier-1 suppliers, is particularly relevant for buyers looking to deepen local sourcing relationships rather than relying on foreign-invested factories alone.
One of the resolution's more candid acknowledgements is that Vietnam has historically struggled with low localization rates and limited technology transfer from foreign-invested enterprises to domestic firms. The gap between large foreign manufacturers and local supplier capability has been a persistent structural weakness.
Resolution 10 directly targets this by tying incentives to supplier development outcomes and establishing national supplier databases and cooperation mechanisms. Whether implementation matches ambition will take time to assess — but the policy direction is clear and represents a meaningful change from previous frameworks.
Vietnam has been one of Asia's most dynamic manufacturing destinations for the past decade, and this resolution reflects the country's awareness that the next phase of growth requires a different approach. Moving from volume-driven FDI attraction to quality-focused industrial policy is a logical progression for an economy at Vietnam's stage of development.
For buyers currently sourcing from Vietnam or planning to, this is a constructive signal. A more technologically capable and better-integrated manufacturing base ultimately creates better sourcing options — more reliable suppliers, stronger quality systems, and a wider range of product categories that can be produced competitively in-country.
The transition will take years rather than months, but the direction is worth tracking.